Analytics
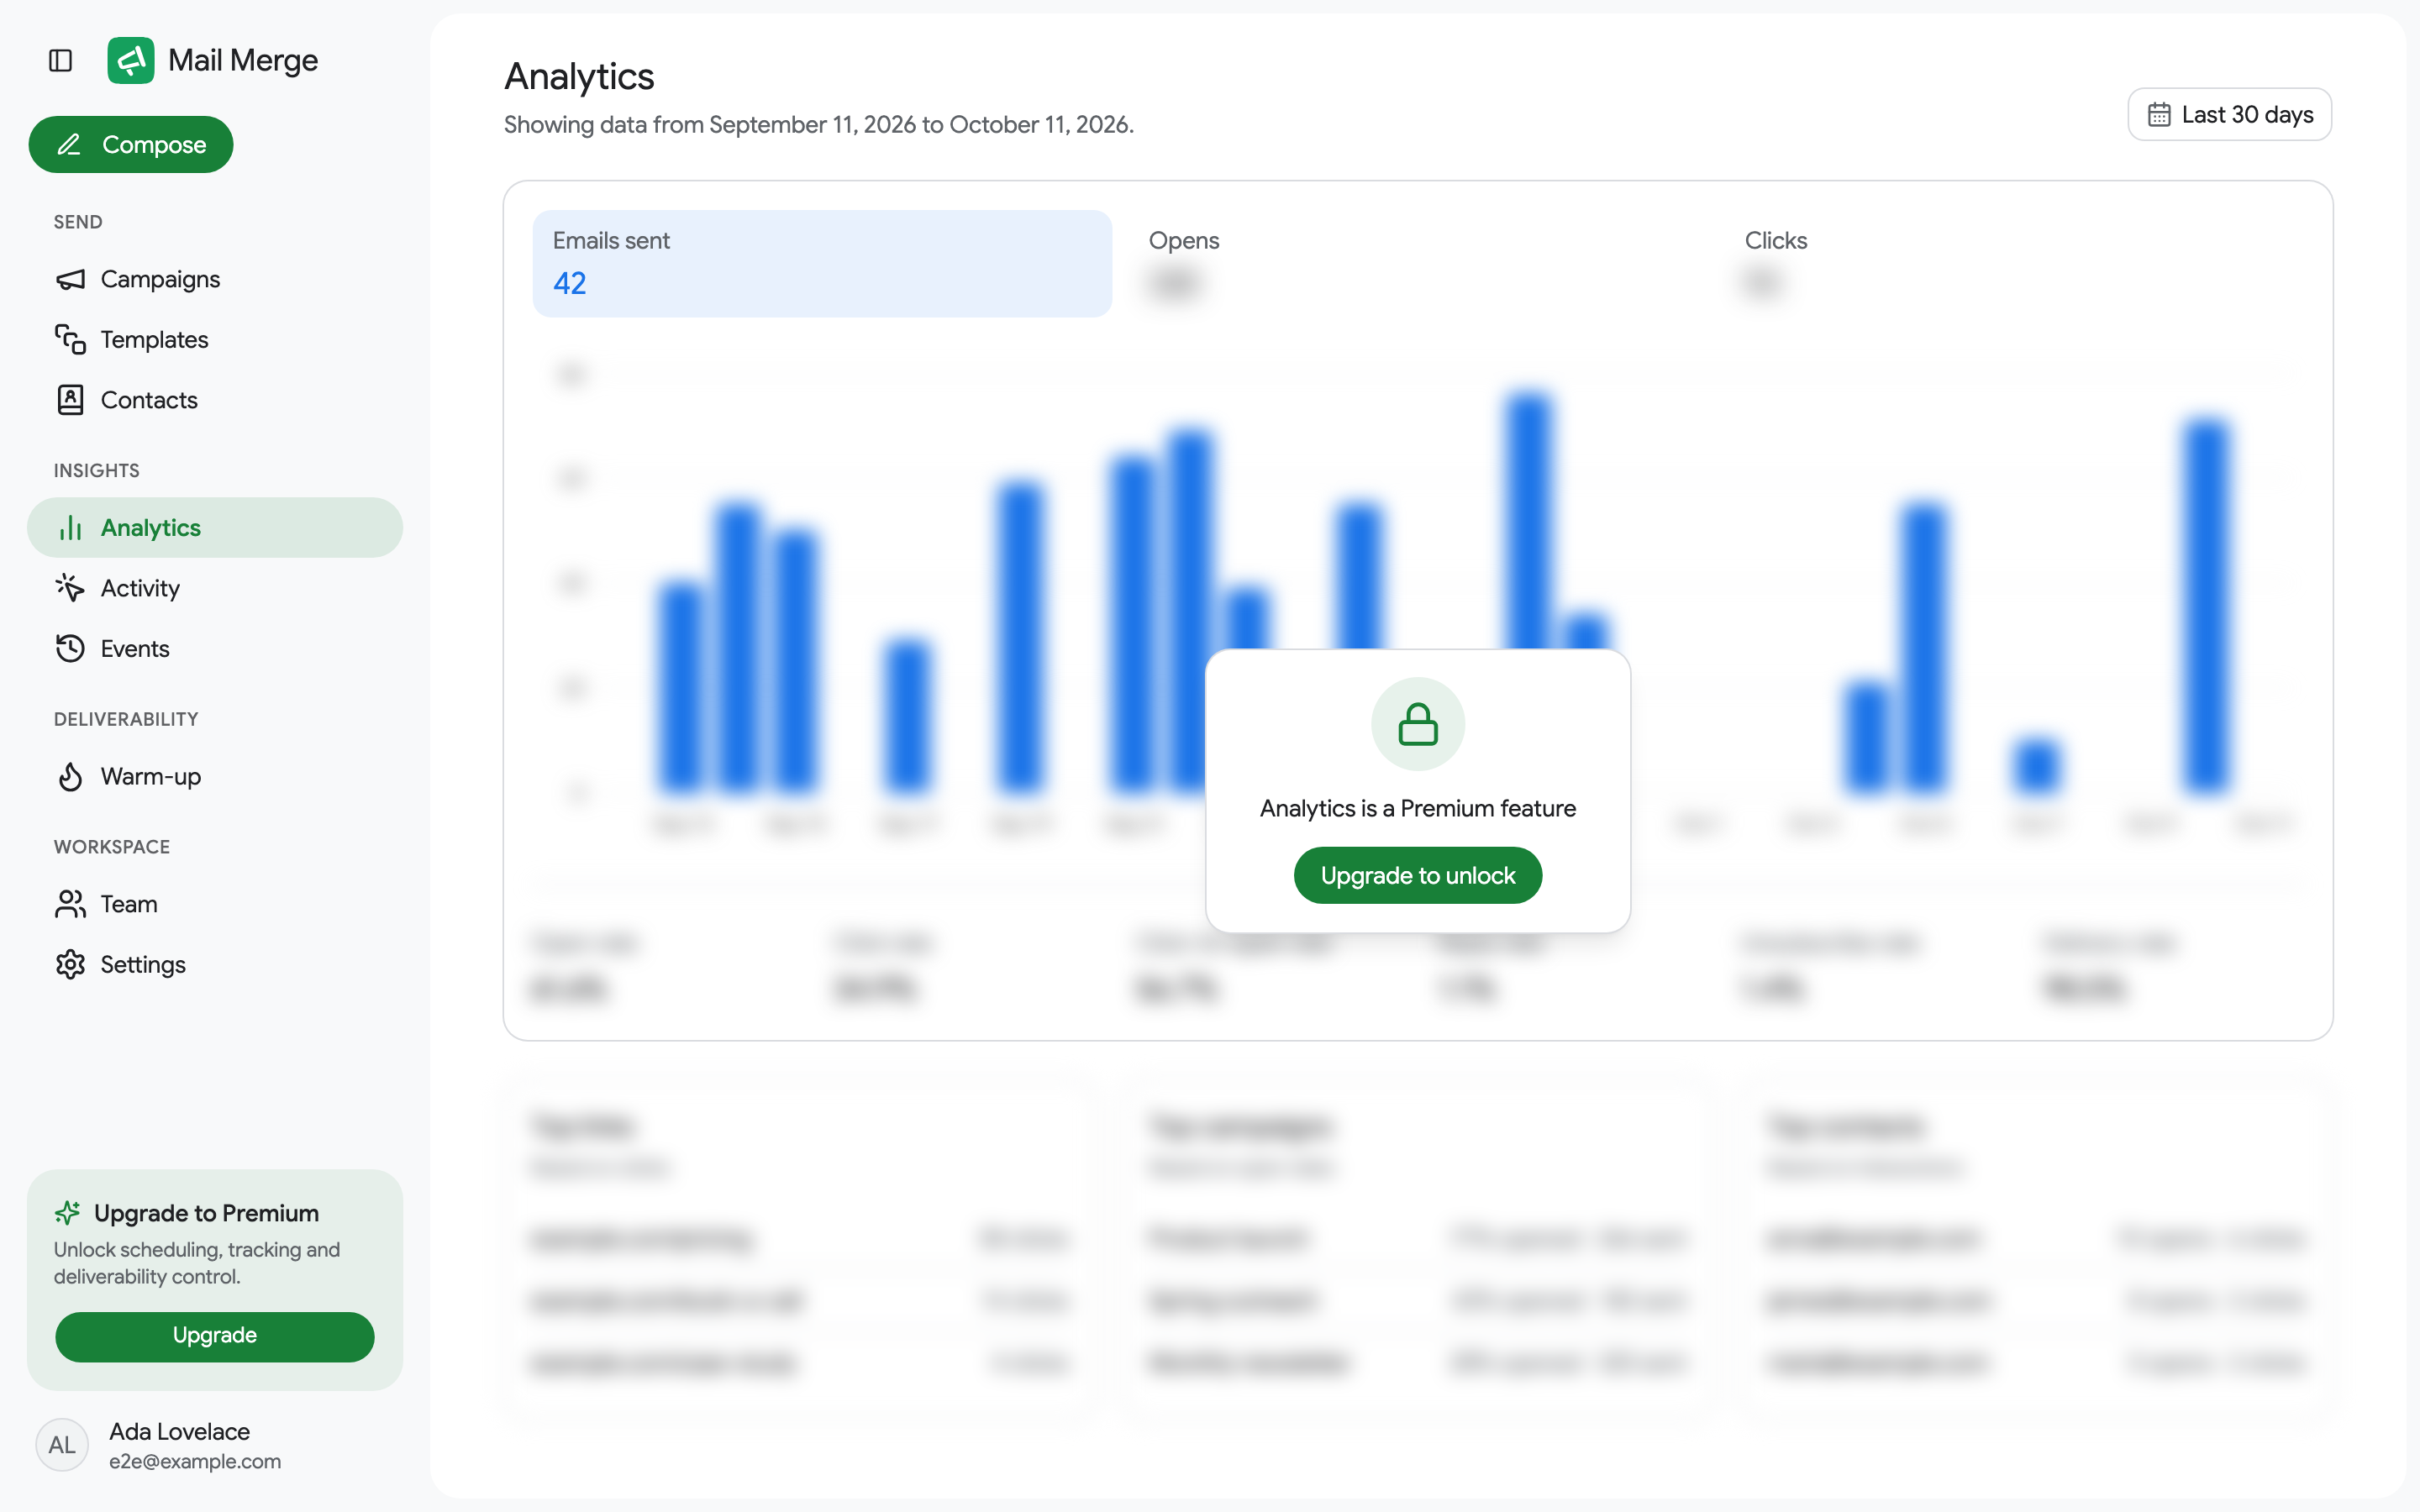
Analytics aggregates every tracked campaign on your account: how many emails you sent, how many were opened and clicked, the rates that matter, and what performed best. Open it from the Insights group of the sidebar.
Choosing a period
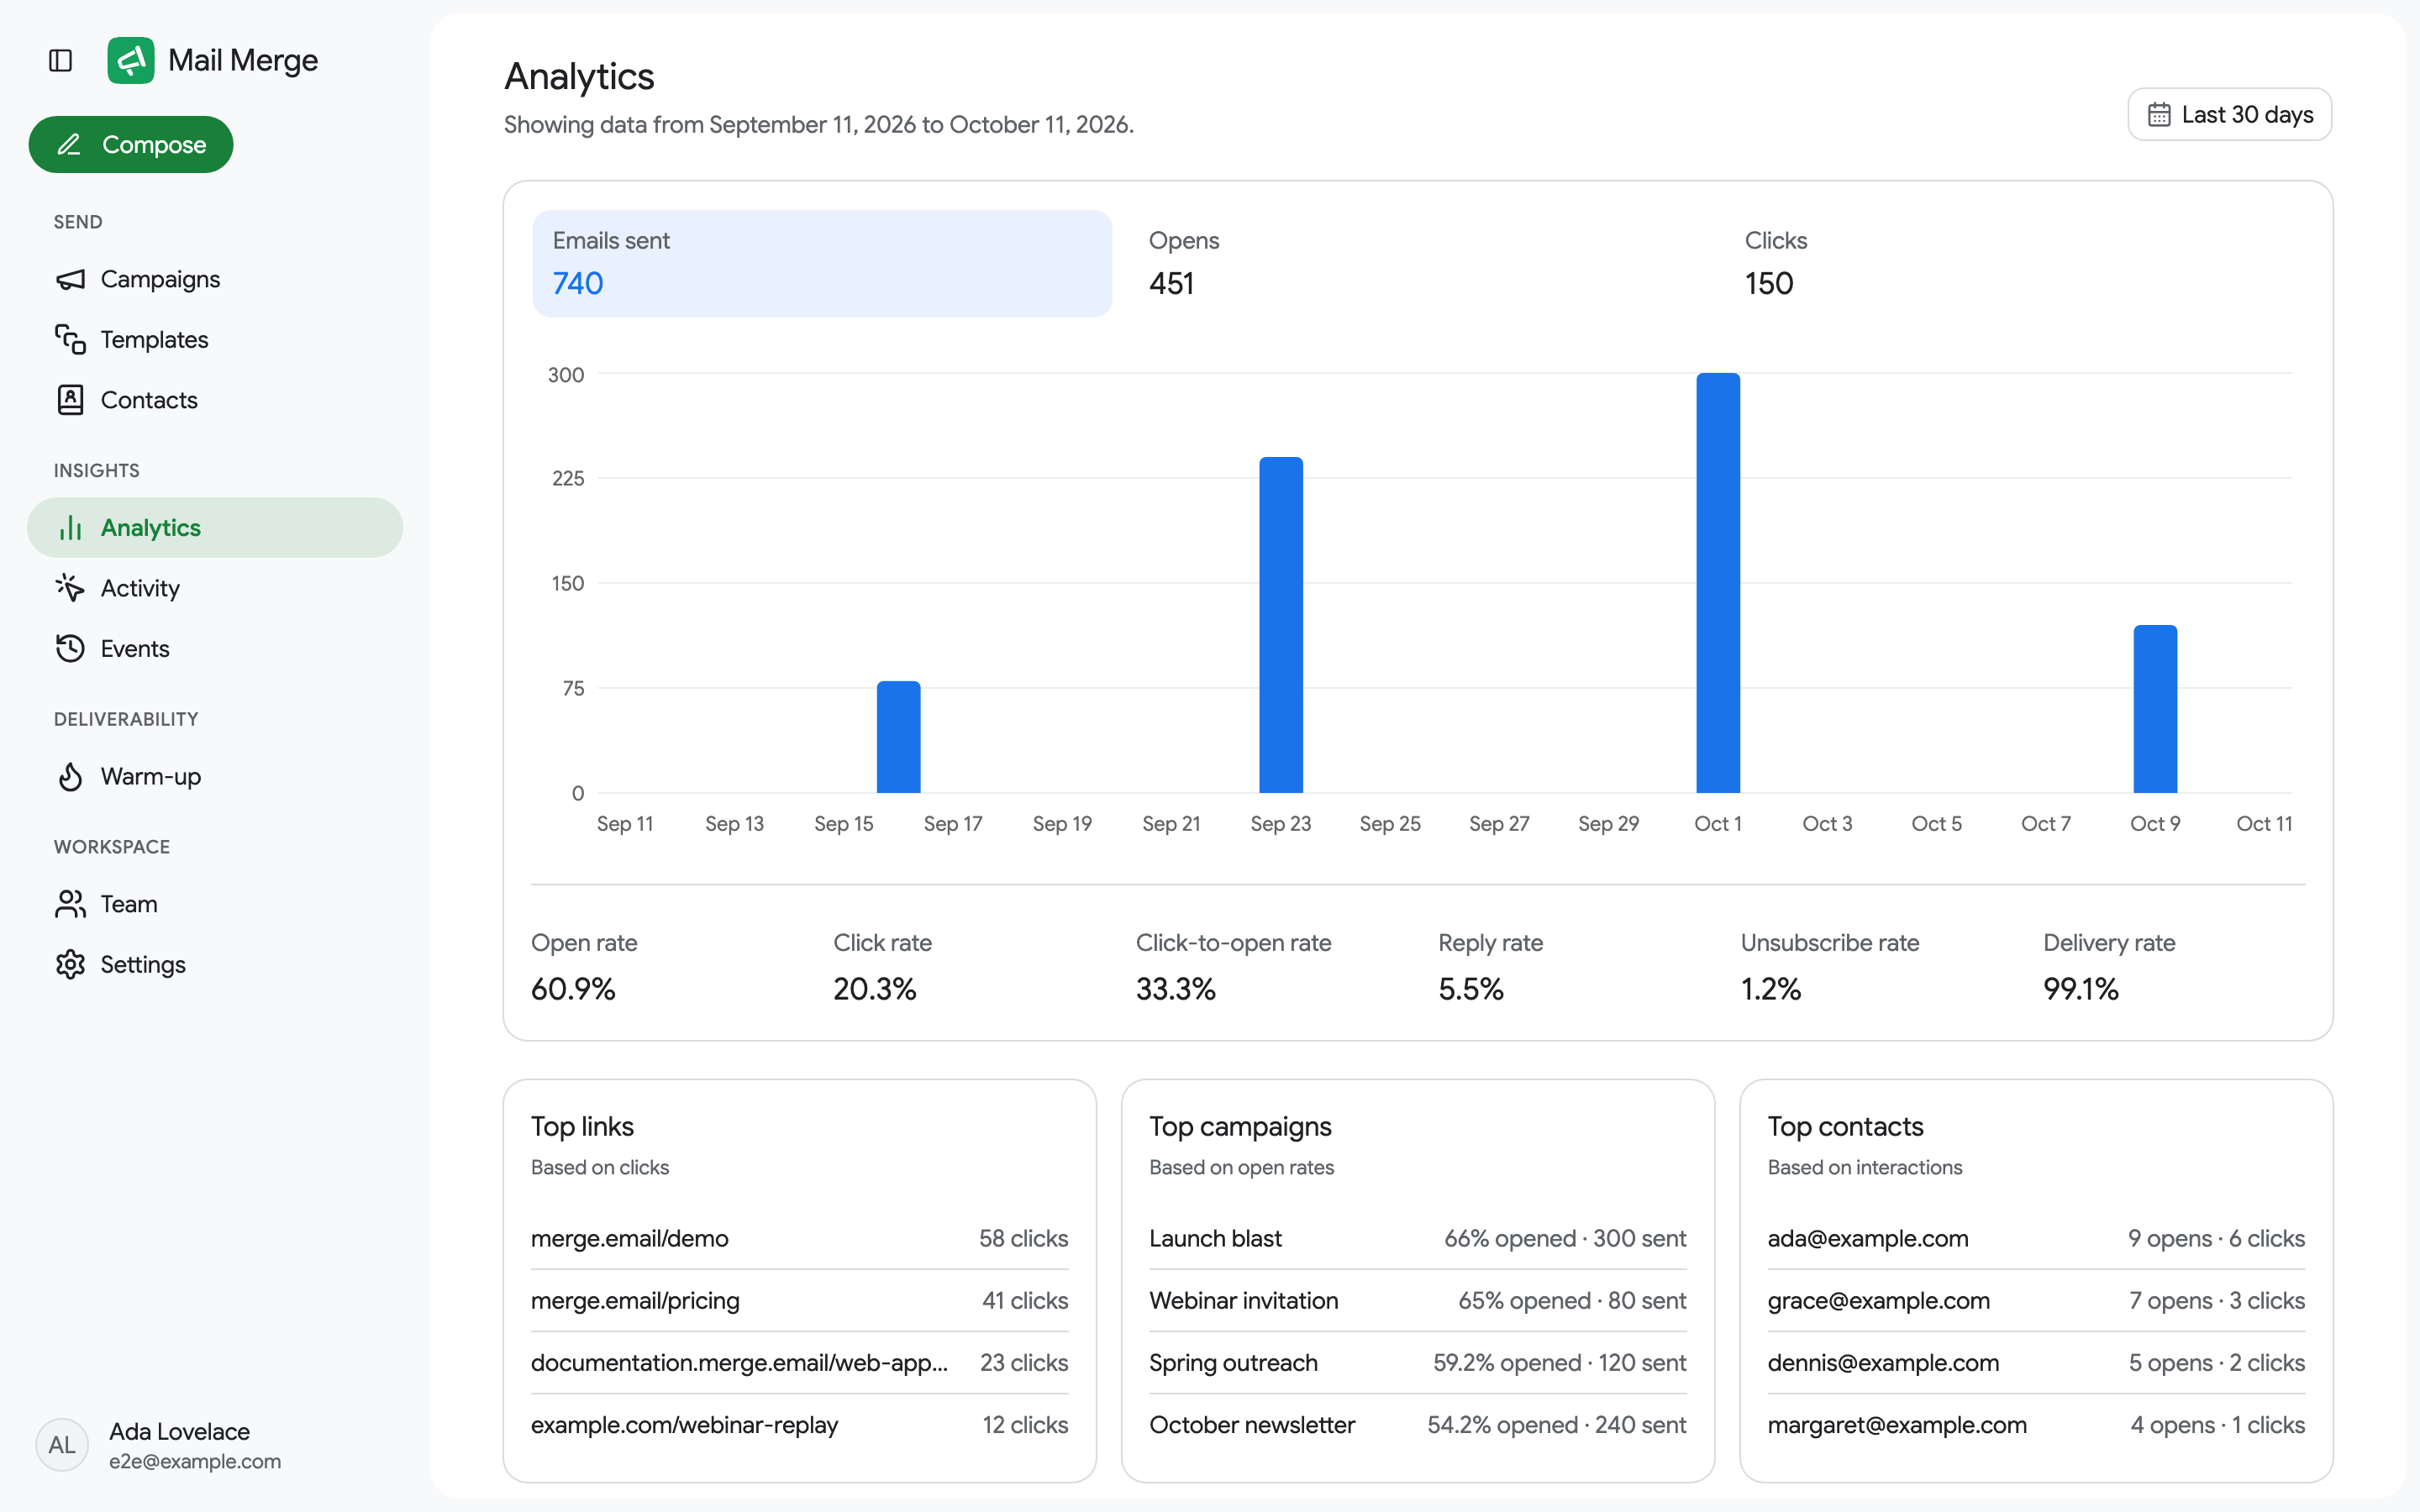
Section titled “Choosing a period”The button in the top-right corner picks the period. Presets go from Today to All time, with Last 30 days as the default; the calendar below them selects a custom range by clicking a start and an end day. The subtitle always states the dates being shown.
The overview card
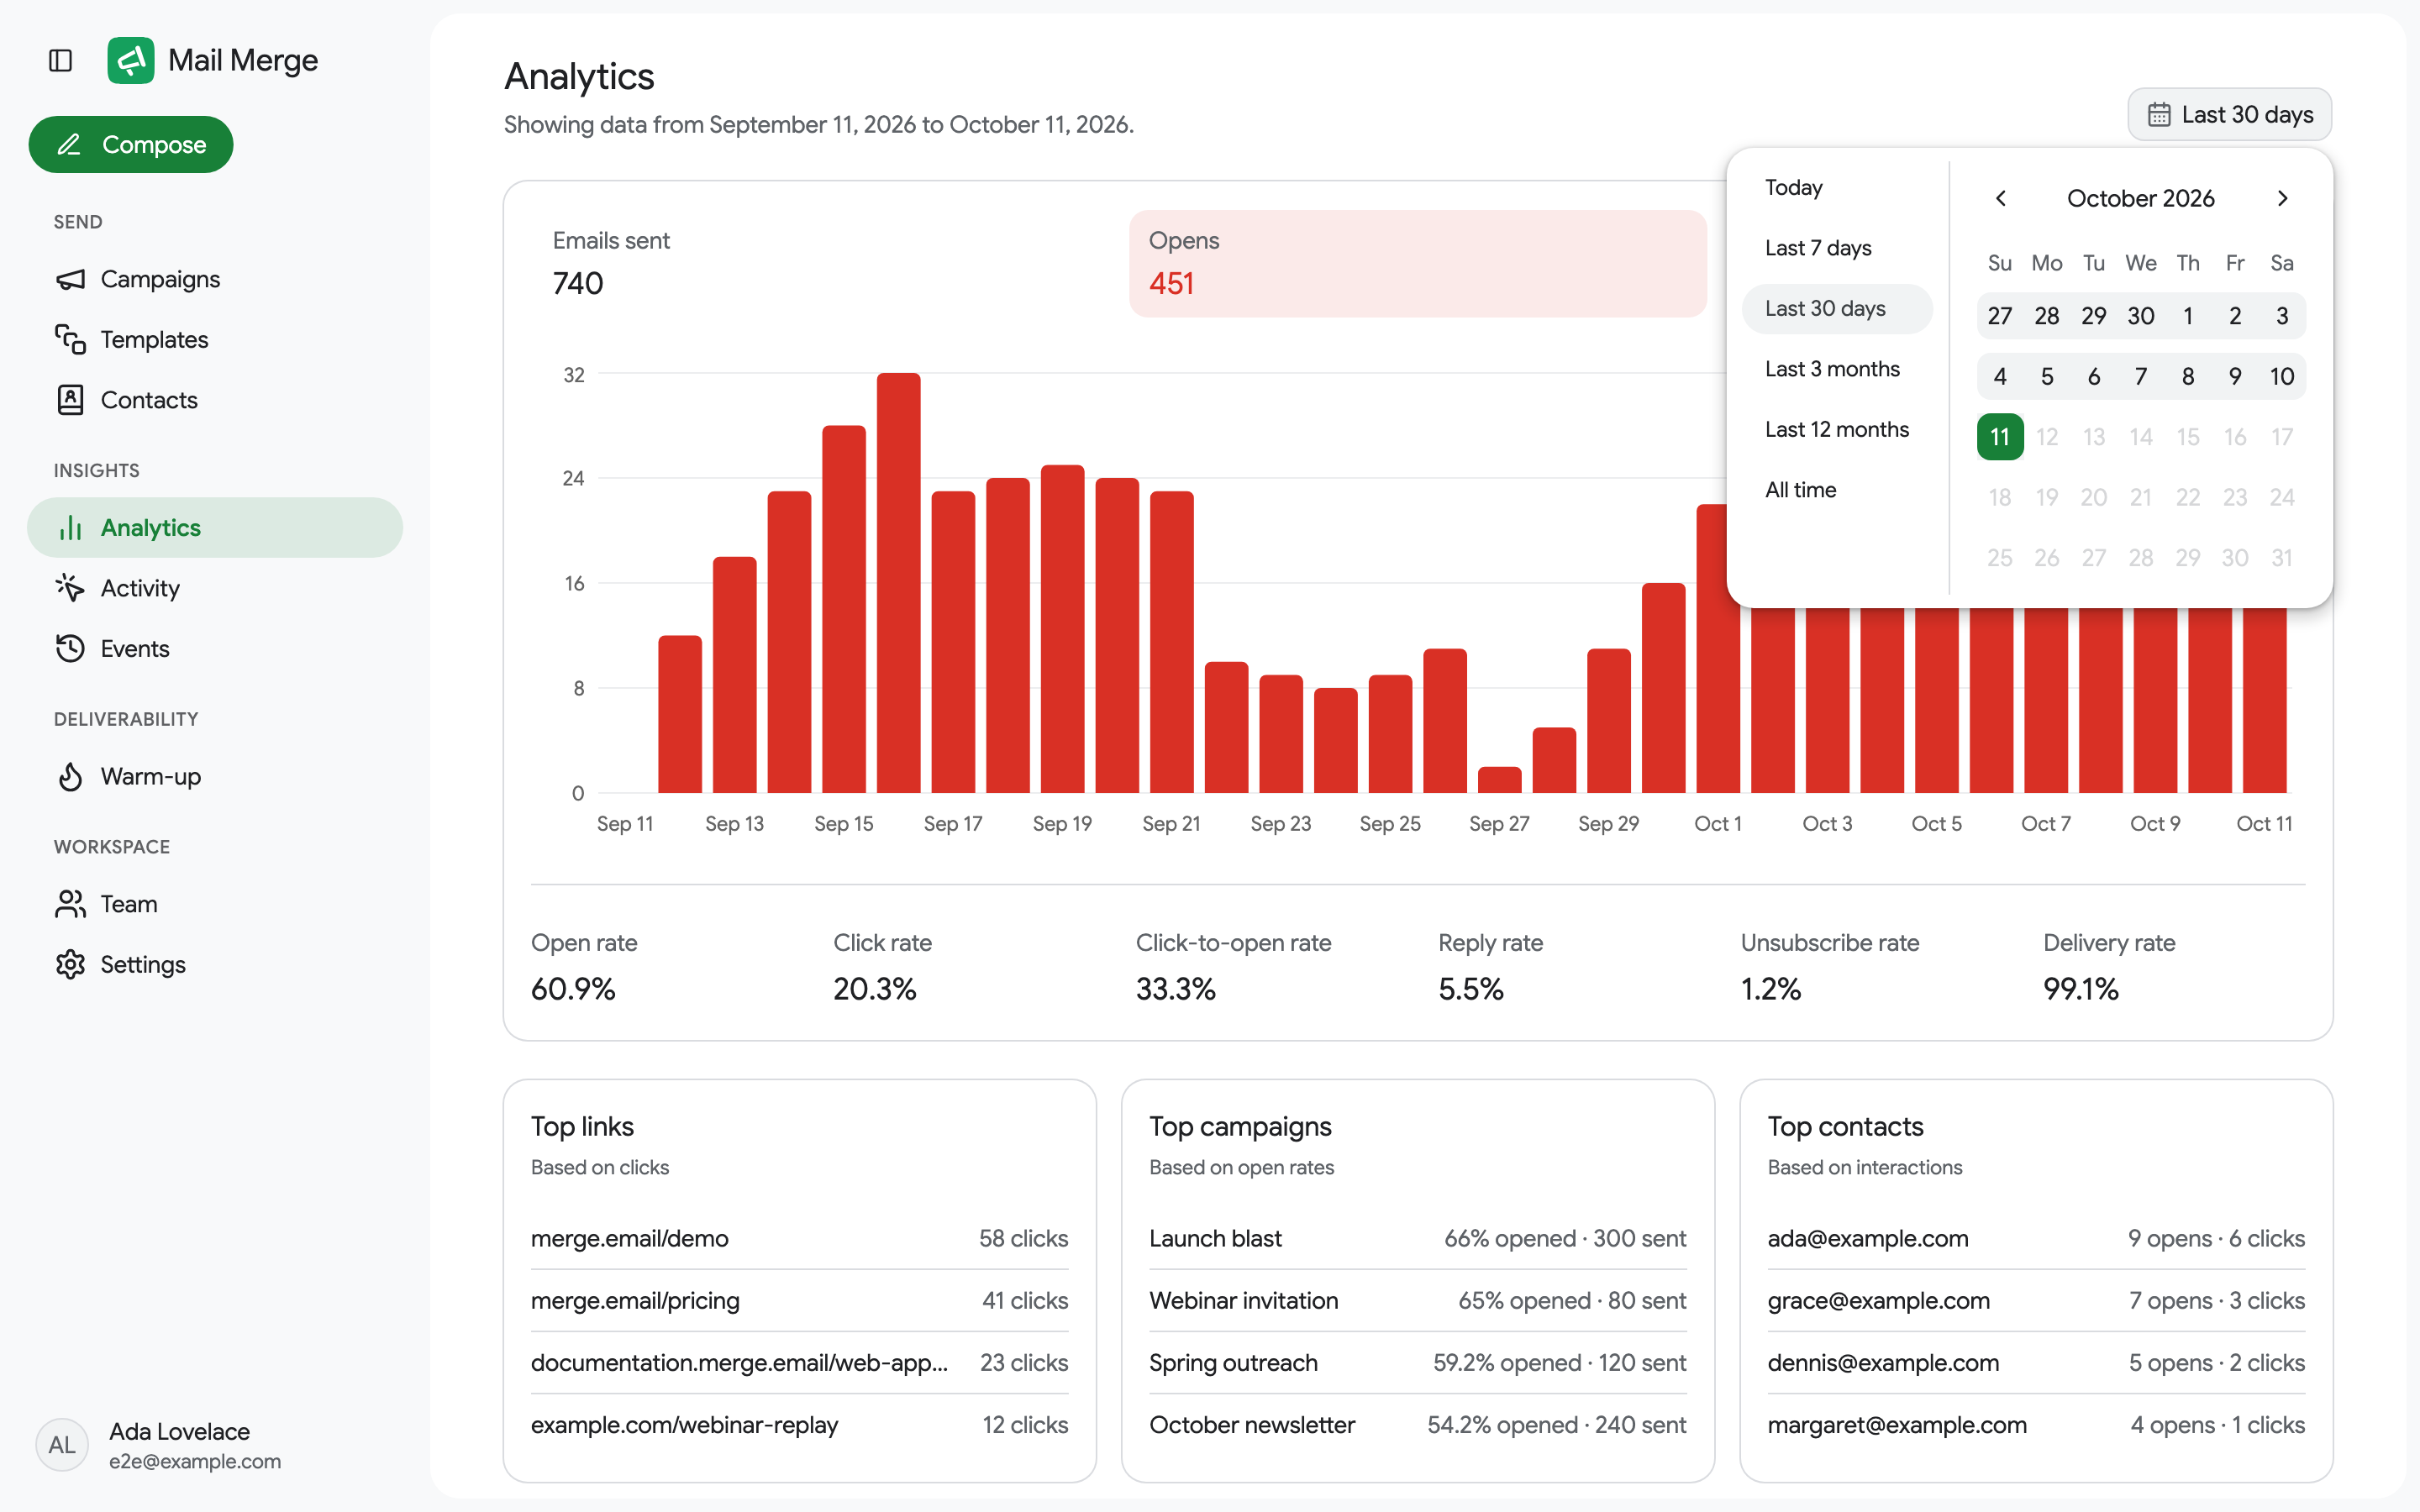
Section titled “The overview card”Three tiles at the top count Emails sent, Opens and Clicks for the period. Click a tile to plot that metric in the chart below: one bar per day, or per month for the longest ranges.
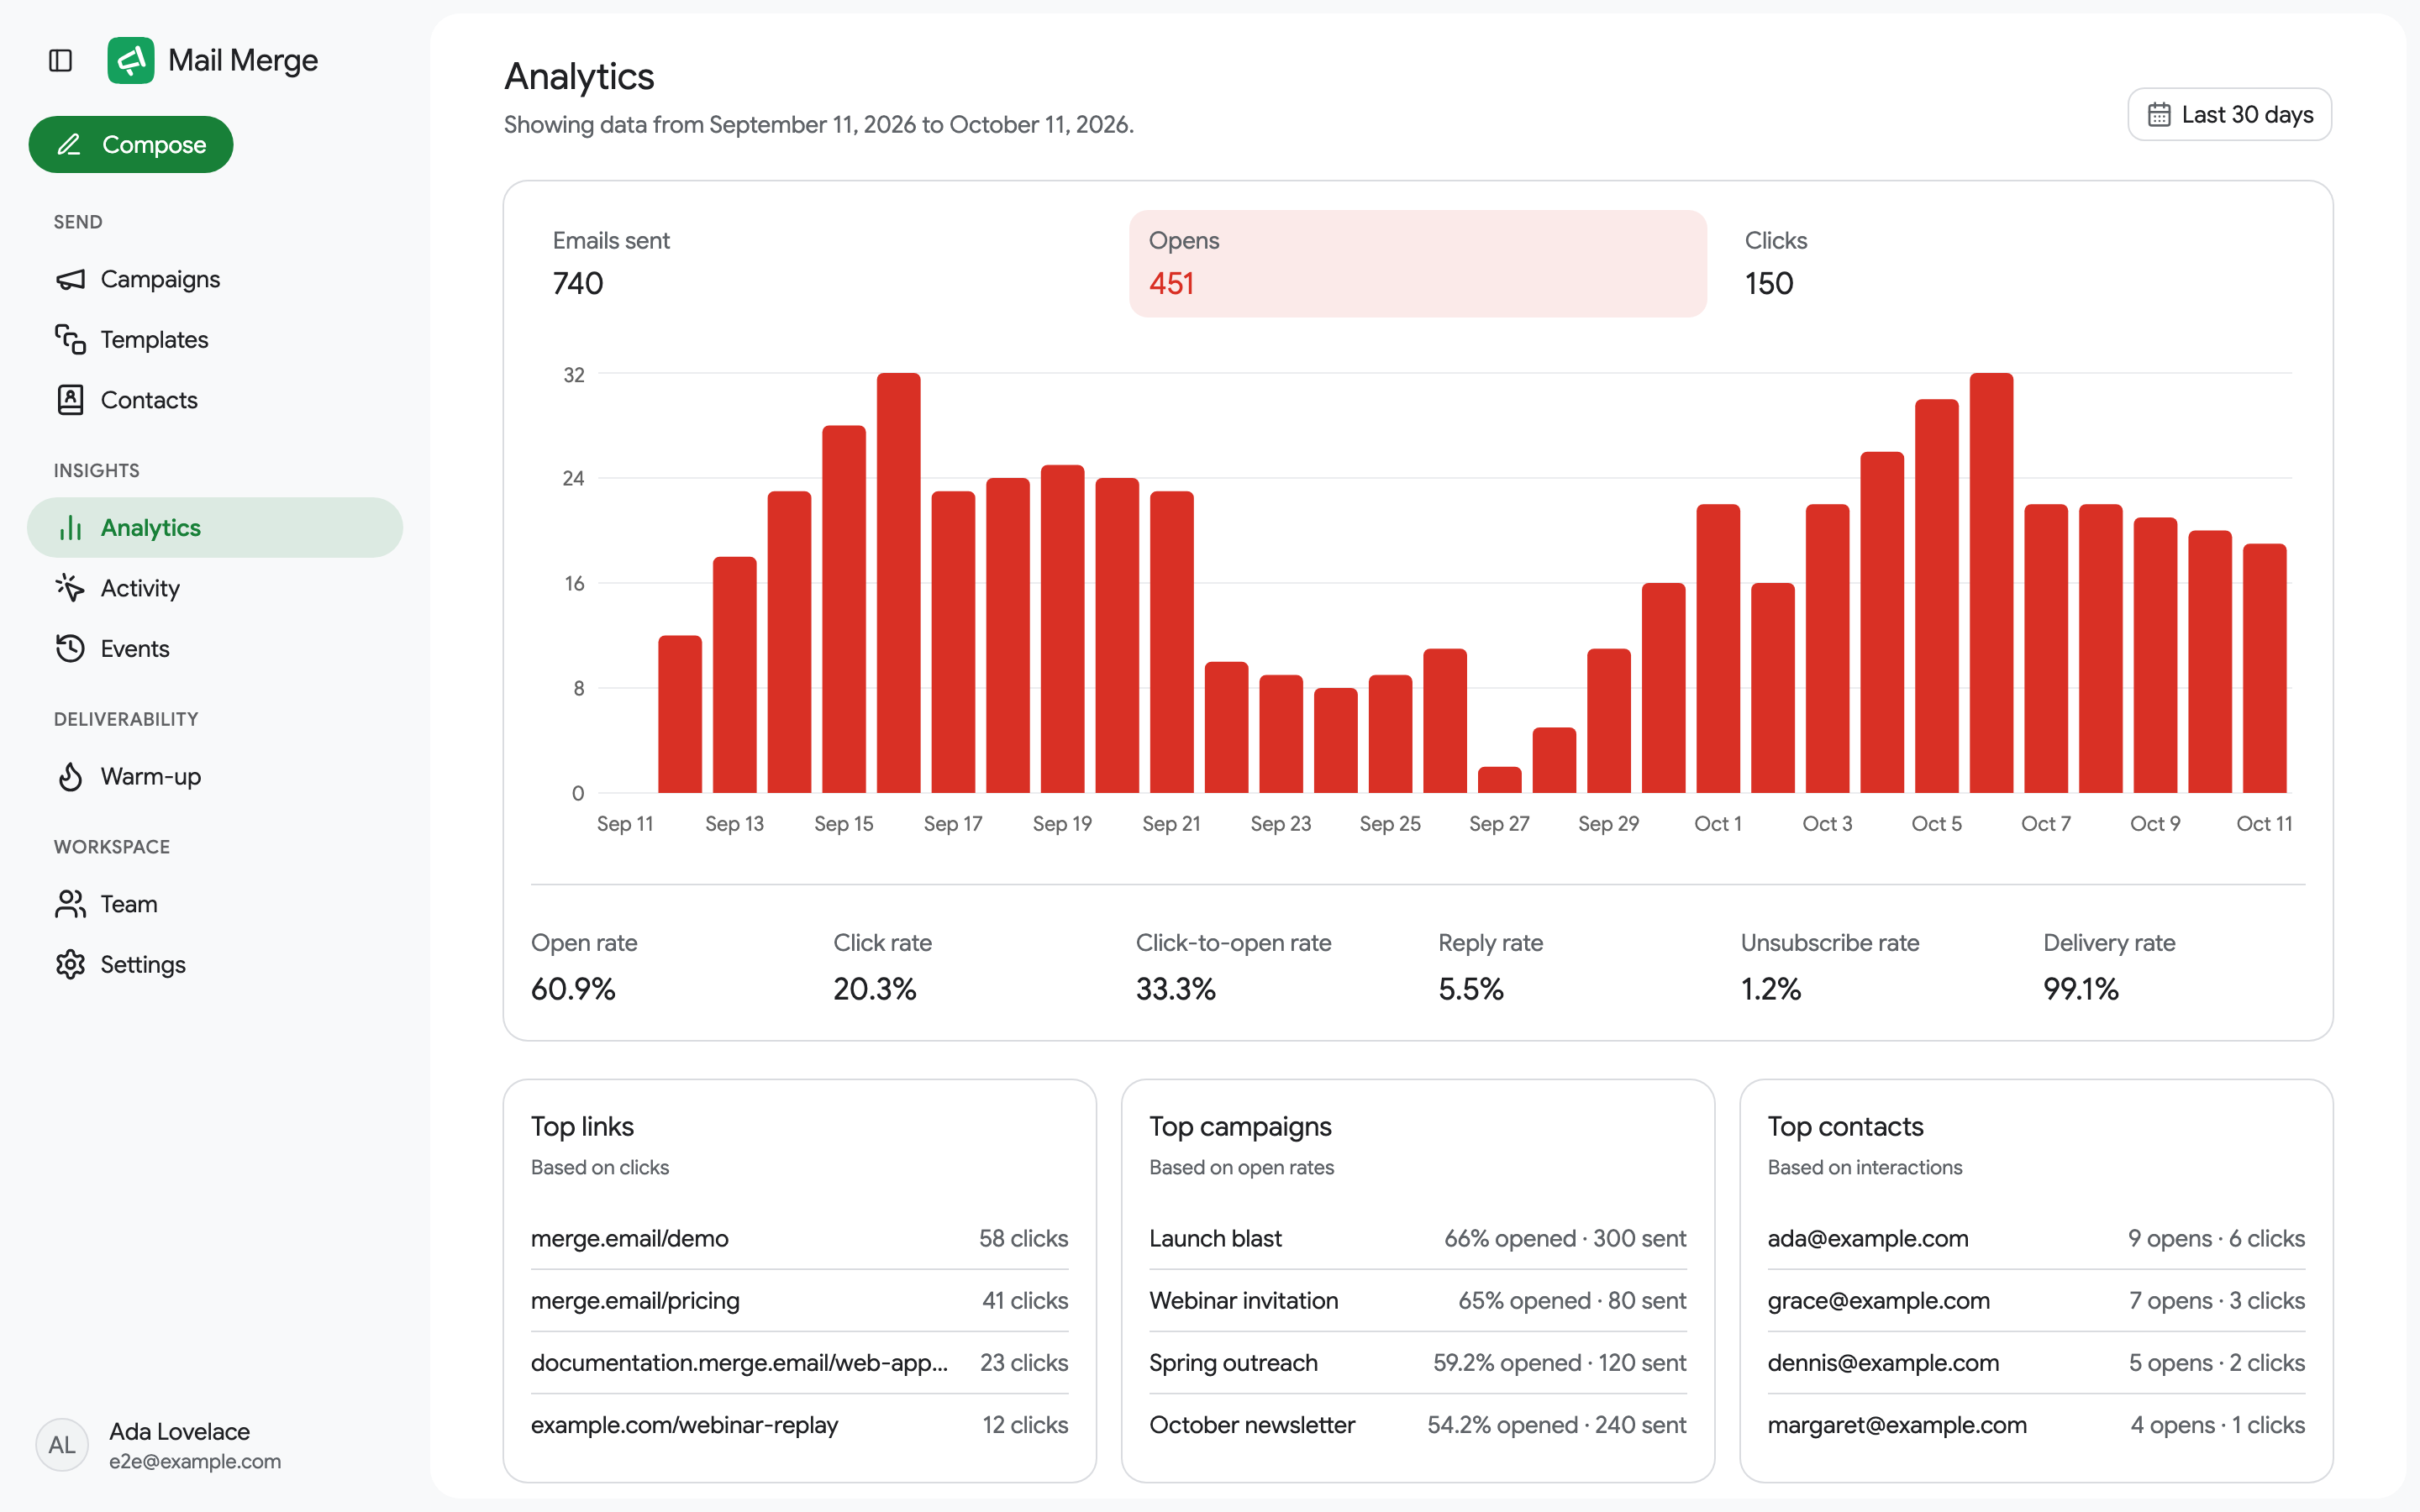
Under the chart, six rates:
| Rate | How it is computed |
|---|---|
| Open rate | Unique opens divided by tracked sends. |
| Click rate | Unique clicks divided by tracked sends. |
| Click-to-open rate | Clicks divided by opens: how convincing the email was once read. |
| Reply rate | Replies divided by all sends. |
| Unsubscribe rate | Unsubscribes divided by tracked sends. |
| Delivery rate | Sends minus bounces and errors, divided by sends. |
Opens, clicks and unsubscribes need tracking to be on; campaigns sent without it count in Emails sent and in the delivery rate only.
Top lists
Section titled “Top lists”- Top links, by clicks: which URLs in your emails were clicked most.
- Top campaigns, by open rate, with the number of emails each one sent.
- Top contacts, by opens and clicks: your most engaged recipients.
For a recipient-by-recipient view, see Activity.